Average Latency Feedback
The following policy is based on the Load Scheduling with Average Latency Feedback blueprint.
Overview
The response times of a service start to deteriorate when the service's underlying concurrency limit is surpassed. Consequently, a degradation in response latency can serve as a reliable signal for identifying service overload. This policy is designed to detect overload situations based on latency deterioration. During overload, the request rate is throttled so that latency gets restored back to an acceptable range.
Configuration
This policy monitors the latency of requests processed by the
cart-service.prod.svc.cluster.local service. It calculates the deviations
in current latency from a baseline historical latency, which serves as an
indicator of service overload. A deviation of 1.1 from the baseline is
considered as a signal of service overload.
To mitigate service overload, the requests to the
cart-service.prod.svc.cluster.local service are passed through a load
scheduler. The load scheduler reduces the request rate in overload scenarios,
temporarily placing excess requests in a queue.
As service latency improves, indicating a return to normal operational state, the request rate is incrementally increased until it matches the incoming request rate. This responsive mechanism helps ensure that service performance is optimized while mitigating the risk of service disruptions due to overload.
- aperturectl values.yaml
# yaml-language-server: $schema=../../../../../../blueprints/load-scheduling/average-latency/gen/definitions.json
# Generated values file for load-scheduling/average-latency blueprint
# Documentation/Reference for objects and parameters can be found at:
# https://docs.fluxninja.com/reference/blueprints/load-scheduling/average-latency

policy:
  # Name of the policy.
  # Type: string
  # Required: True
  policy_name: basic-service-protection
  service_protection_core:
    adaptive_load_scheduler:
      load_scheduler:
        # The selectors determine the flows that are protected by this policy.
        # Type: []aperture.spec.v1.Selector
        # Required: True
        selectors:
          - control_point: ingress
            service: cart-service.prod.svc.cluster.local
  latency_baseliner:
    # Tolerance factor beyond which the service is considered to be in overloaded state. E.g. if the long-term average of latency is L and if the tolerance is T, then the service is considered to be in an overloaded state if the short-term average of latency is more than L*T.
    # Type: float64
    latency_tolerance_multiplier: 1.1
    # Flux Meter defines the scope of latency measurements.
    # Type: aperture.spec.v1.FluxMeter
    # Required: True
    flux_meter:
      selectors:
        - control_point: ingress
          service: cart-service.prod.svc.cluster.local
Generated Policy
Circuit Diagram for this policy.
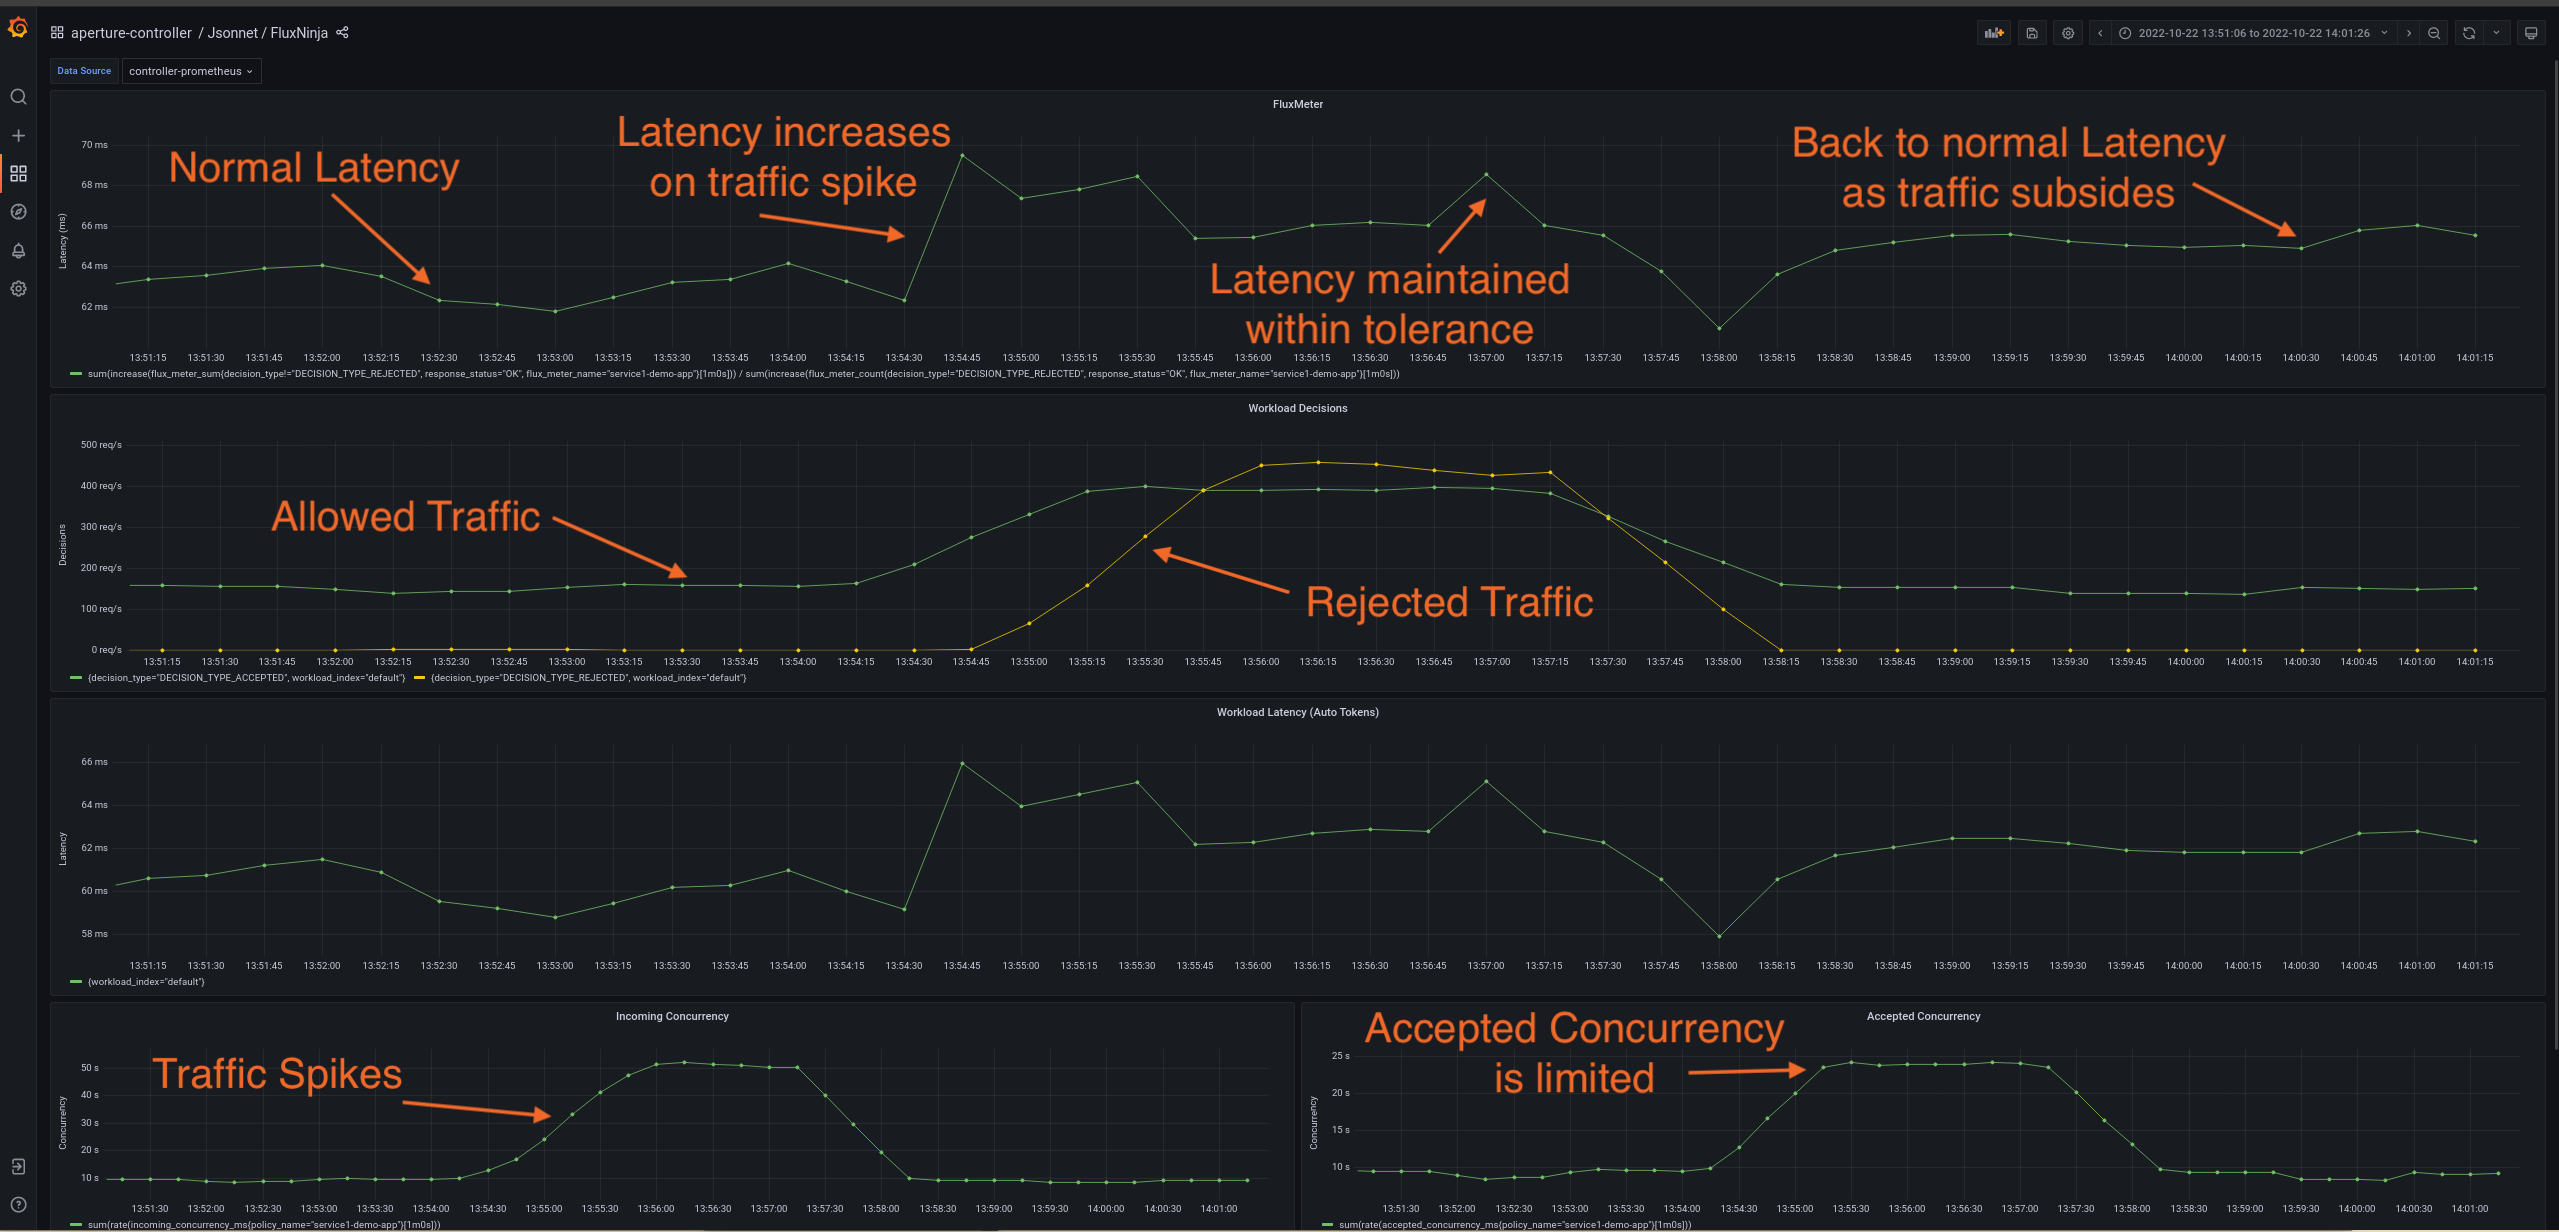
Policy in Action
To see the policy in action, the traffic is generated such that it starts within
the service's capacity and then goes beyond the capacity after some time. Such a
traffic pattern is repeated periodically. The below dashboard demonstrates that
when latency spikes due to high traffic at
cart-service.prod.svc.cluster.local, the controller throttles the rate of
requests admitted into the service. This approach helps protect the service from
becoming unresponsive and maintains the current latency within the tolerance
limit (1.1) of historical latency.
Dry Run Mode
You can run this policy in the Dry Run mode by setting the
default_config.dry_run option to true. In the Dry Run mode, the policy
does not throttle the request rate while still evaluating the decisions it would
take in each cycle. This is useful for evaluating the policy without impacting
the service.
The Dry Run mode can also be toggled dynamically at runtime, without reloading
the policy.
Demo Video
The below demo video shows the basic service protection and workload prioritization policy in action within Aperture Playground.