Detecting Overload
Overview
Monitoring the health of a service is a critical aspect of ensuring reliable operations. This policy provides a mechanism for detecting an overload state of a service and sending alerts using Aperture's declarative policy language. The policy creates a circuit that models the typical latency behavior of the service using an exponential moving average (EMA). This automated learning of the normal latency threshold for each service reduces the need for manual tuning of alert policies.
One reliable metric for detecting overload is the latency of service requests. In Aperture, latency can be reported using a Flux Meter.
To prevent the mixing of latency measurements across different workloads, it's recommended to apply the Flux Meter to a single type of workload. For instance, if a service has both Select and Insert API calls, it is advised to measure the latency of only one of these workloads using a Flux Meter. Refer to the Selector documentation for guidance on applying the Flux Meter to a subset of API calls for a service.
Configuration
In this example, the EMA of latency of checkout-service.prod.svc.cluster.local
is computed using metrics reported by the Flux Meter and obtained periodically
through a
PromQL query.
The EMA of latency is then multiplied by a tolerance factor to calculate the
setpoint latency, which serves as a threshold for detecting an overloaded
state - if the real-time latency of the service exceeds this setpoint (which is
based on the long-term EMA), the service is considered overloaded.
- YAML
- Jsonnet
apiVersion: fluxninja.com/v1alpha1
kind: Policy
metadata:
  labels:
    fluxninja.com/validate: "true"
  name: signal-processing
spec:
  circuit:
    components:
      - query:
          promql:
            evaluation_interval: 10s
            out_ports:
              output:
                signal_name: LATENCY
            query_string:
              sum(increase(flux_meter_sum{decision_type!="DECISION_TYPE_REJECTED",
              flow_status="OK",
              flux_meter_name="test"}[30s]))/sum(increase(flux_meter_count{decision_type!="DECISION_TYPE_REJECTED",
              flow_status="OK", flux_meter_name="test"}[30s]))
      - ema:
          in_ports:
            input:
              signal_name: LATENCY
          out_ports:
            output:
              signal_name: LATENCY_EMA
          parameters:
            ema_window: 1500s
            warmup_window: 10s
      - arithmetic_combinator:
          in_ports:
            lhs:
              signal_name: LATENCY_EMA
            rhs:
              constant_signal:
                value: 1.1
          operator: mul
          out_ports:
            output:
              signal_name: LATENCY_SETPOINT
      - decider:
          in_ports:
            lhs:
              signal_name: LATENCY
            rhs:
              signal_name: LATENCY_SETPOINT
          operator: gt
          out_ports:
            output:
              signal_name: IS_OVERLOAD_SWITCH
      - alerter:
          in_ports:
            signal:
              signal_name: IS_OVERLOAD_SWITCH
          parameters:
            alert_name: overload
            severity: crit
    evaluation_interval: 10s
  resources:
    flow_control:
      flux_meters:
        test:
          selectors:
            - agent_group: default
              control_point: ingress
              service: service1-demo-app.demoapp.svc.cluster.local
local aperture = import 'github.com/fluxninja/aperture/blueprints/main.libsonnet';

local policy = aperture.spec.v1.Policy;
local component = aperture.spec.v1.Component;
local query = aperture.spec.v1.Query;
local selector = aperture.spec.v1.Selector;
local circuit = aperture.spec.v1.Circuit;
local port = aperture.spec.v1.Port;
local resources = aperture.spec.v1.Resources;
local flowControlResources = aperture.spec.v1.FlowControlResources;
local fluxMeter = aperture.spec.v1.FluxMeter;
local promQL = aperture.spec.v1.PromQL;
local ema = aperture.spec.v1.EMA;
local emaParameters = aperture.spec.v1.EMAParameters;
local combinator = aperture.spec.v1.ArithmeticCombinator;
local decider = aperture.spec.v1.Decider;
local alerter = aperture.spec.v1.Alerter;
local alerterParameters = aperture.spec.v1.AlerterParameters;

local svcSelectors = [
  selector.new()
  + selector.withControlPoint('ingress')
  + selector.withService('service1-demo-app.demoapp.svc.cluster.local')
  + selector.withAgentGroup('default'),
];

local policyDef =
  policy.new()
  + policy.withResources(
    resources.new()
    + resources.withFlowControl(flowControlResources.new()
                                + flowControlResources.withFluxMetersMixin(
                                  { test: fluxMeter.new() + fluxMeter.withSelectors(svcSelectors) }
                                ))
  )
  + policy.withCircuit(
    circuit.new()
    + circuit.withEvaluationInterval('10s')
    + circuit.withComponents([
      component.withQuery(
        query.new()
        + query.withPromql(
          local q = 'sum(increase(flux_meter_sum{decision_type!="DECISION_TYPE_REJECTED", flow_status="OK", flux_meter_name="test"}[30s]))/sum(increase(flux_meter_count{decision_type!="DECISION_TYPE_REJECTED", flow_status="OK", flux_meter_name="test"}[30s]))';
          promQL.new()
          + promQL.withQueryString(q)
          + promQL.withEvaluationInterval('10s')
          + promQL.withOutPorts({ output: port.withSignalName('LATENCY') }),
        ),
      ),
      component.withEma(
        ema.withParameters(
          emaParameters.new()
          + emaParameters.withEmaWindow('1500s')
          + emaParameters.withWarmupWindow('10s')
        )
        + ema.withInPortsMixin(ema.inPorts.withInput(port.withSignalName('LATENCY')))
        + ema.withOutPortsMixin(ema.outPorts.withOutput(port.withSignalName('LATENCY_EMA')))
      ),
      component.withArithmeticCombinator(combinator.mul(port.withSignalName('LATENCY_EMA'),
                                                        port.withConstantSignal(1.1),
                                                        output=port.withSignalName('LATENCY_SETPOINT'))),
      component.withDecider(
        decider.new()
        + decider.withOperator('gt')
        + decider.withInPortsMixin(
          decider.inPorts.withLhs(port.withSignalName('LATENCY'))
          + decider.inPorts.withRhs(port.withSignalName('LATENCY_SETPOINT'))
        )
        + decider.withOutPortsMixin(decider.outPorts.withOutput(port.withSignalName('IS_OVERLOAD_SWITCH')))
      ),
      component.withAlerter(
        alerter.new()
        + alerter.withInPorts({ signal: port.withSignalName('IS_OVERLOAD_SWITCH') })
        + alerter.withParameters(
          alerterParameters.new()
          + alerterParameters.withAlertName('overload')
          + alerterParameters.withSeverity('crit')
        )
      ),
    ]),
  );

local policyResource = {
  kind: 'Policy',
  apiVersion: 'fluxninja.com/v1alpha1',
  metadata: {
    name: 'signal-processing',
    labels: {
      'fluxninja.com/validate': 'true',
    },
  },
  spec: policyDef,
};

policyResource
Circuit Diagram
Installation
Apply this custom policy to the aperture-controller namespace using
aperturectl or kubectl. The
policy section within
aperturectl documentation provides additional information and examples related
the application of policies.
- aperturectl
- kubectl
aperturectl apply policy --file=policy.yaml --kube
kubectl apply -f policy.yaml -n aperture-controller
Policy in Action
As the service processes traffic, various signal metrics collected from the execution of the policy can be visualized:
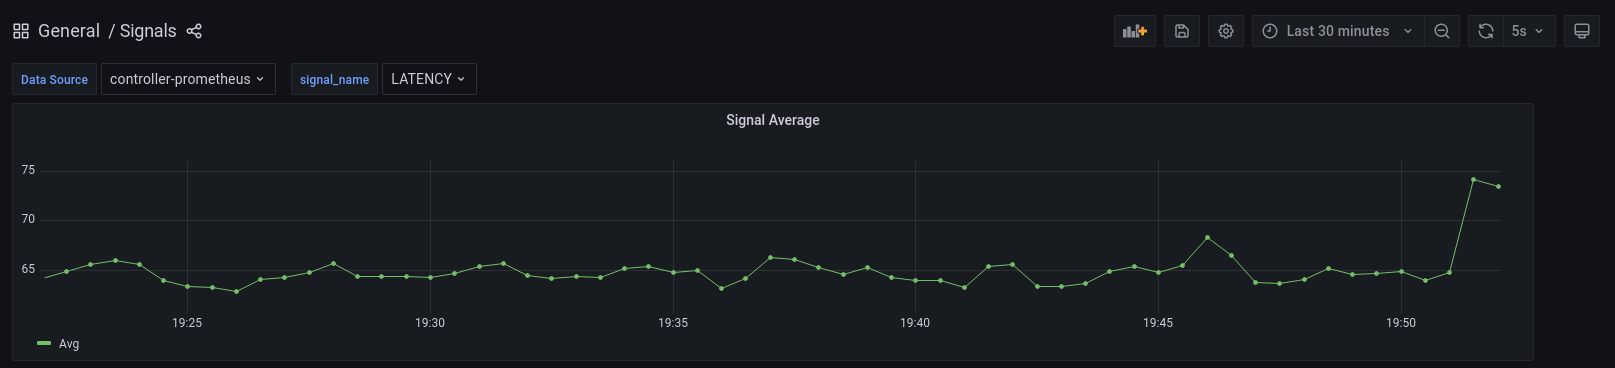
LATENCY: Signal gathered
from the periodic execution of PromQL query on Flux Meter metrics.
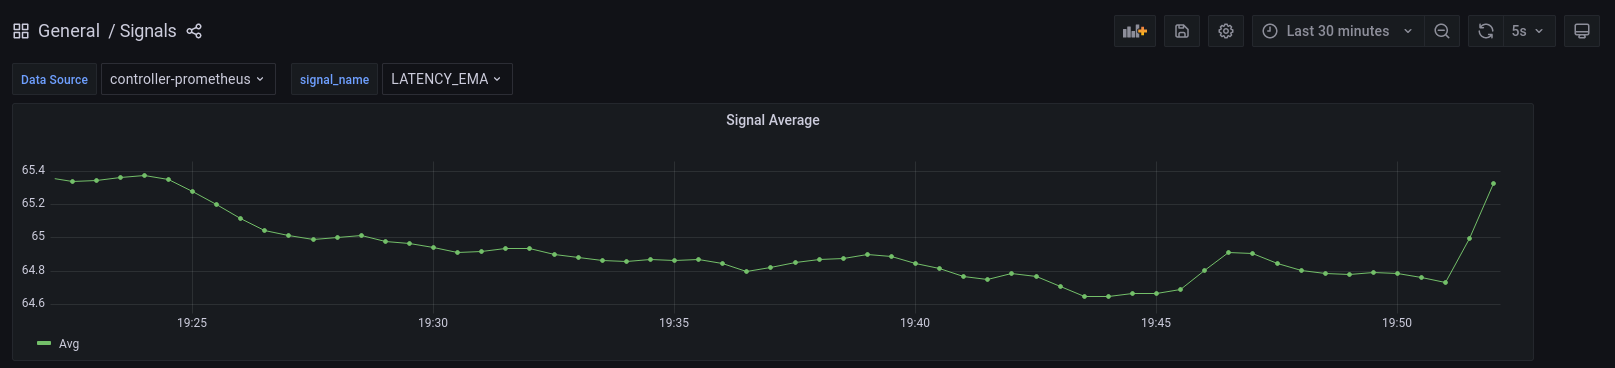
LATENCY_EMA:
Exponential Moving Average of LATENCY signal.
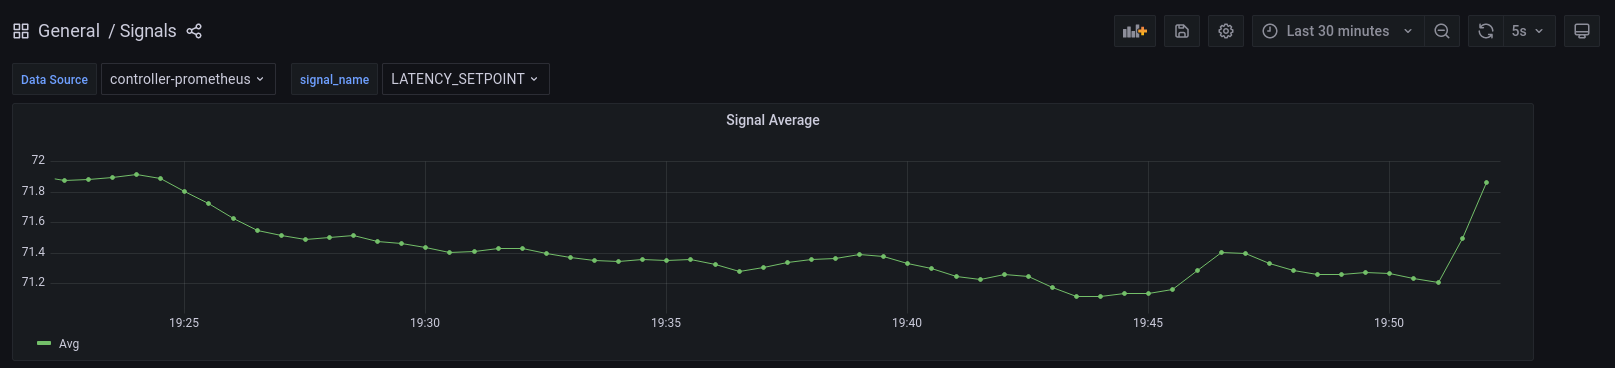
LATENCY_SETPOINT: Latency above which the service is considered to be
overloaded. This is calculated by multiplying the exponential moving average
with a tolerance factor (LATENCY_EMA * 1.1).
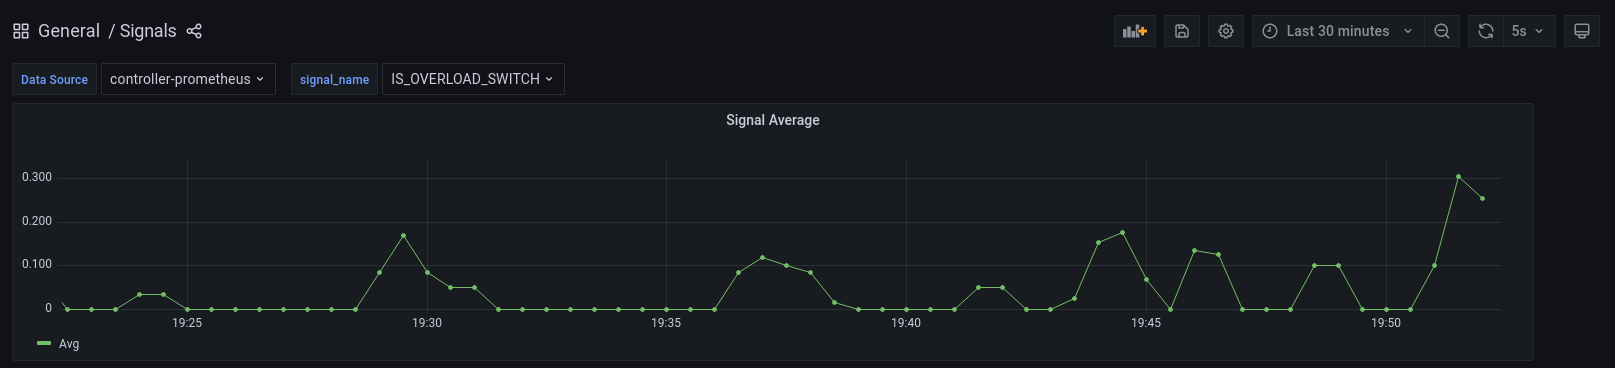
IS_OVERLOAD_SWITCH is a signal that represents whether the service is in an
overloaded state. This signal is derived by comparing LATENCY with
LATENCY_SETPOINT. A value of 0 indicates no overload, while a value of 1
signals an overload.